Open Platform System
Educational Applications with Chlorophyll
Late Professor Apblett from Oklahoma State University provides educational applications for undergraduate laboratories and analytical chemistry using our Open Platform System for chlorophyll measurements.

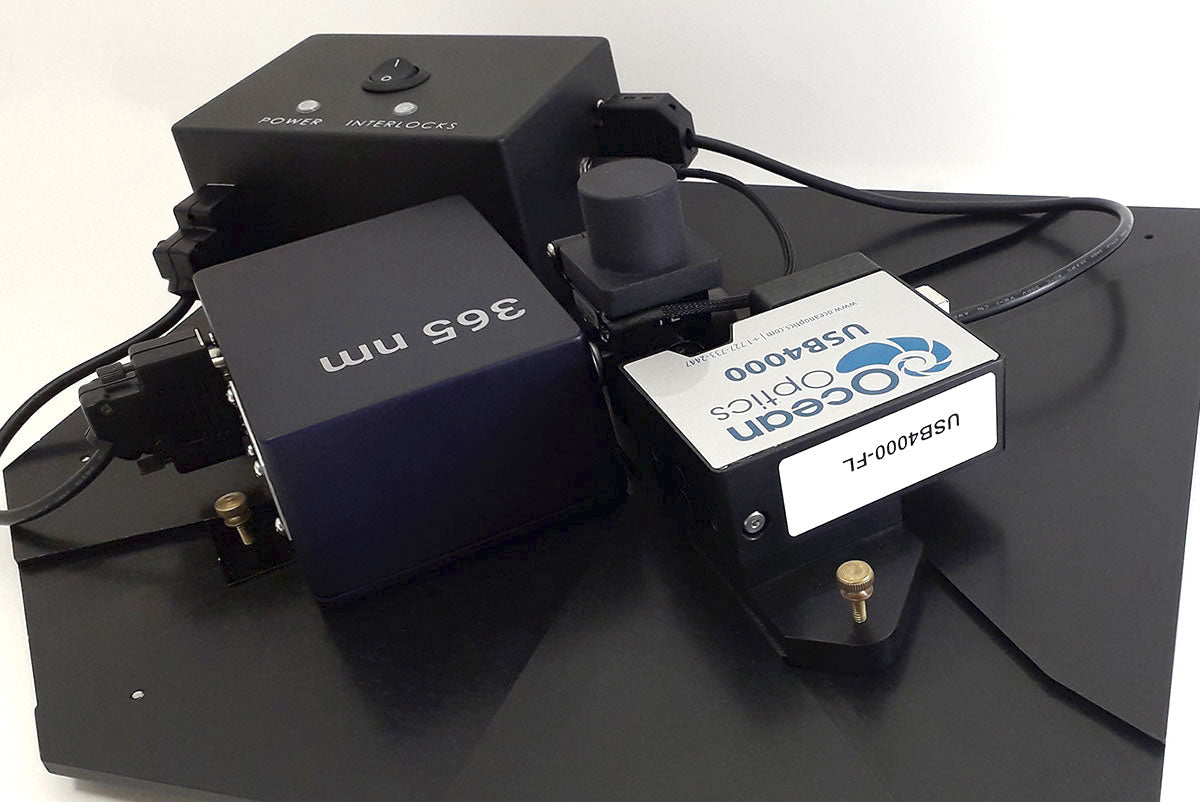
OPEN PLATFORM SYSTEM
Sunscreen UV Protection
Absorbance spectroscopy sunscreen effectiveness measurements at different dilutions with the Open Platform System (OPS) answers when sunscreen effectiveness ends and why we must reapply sunscreen.
Caption
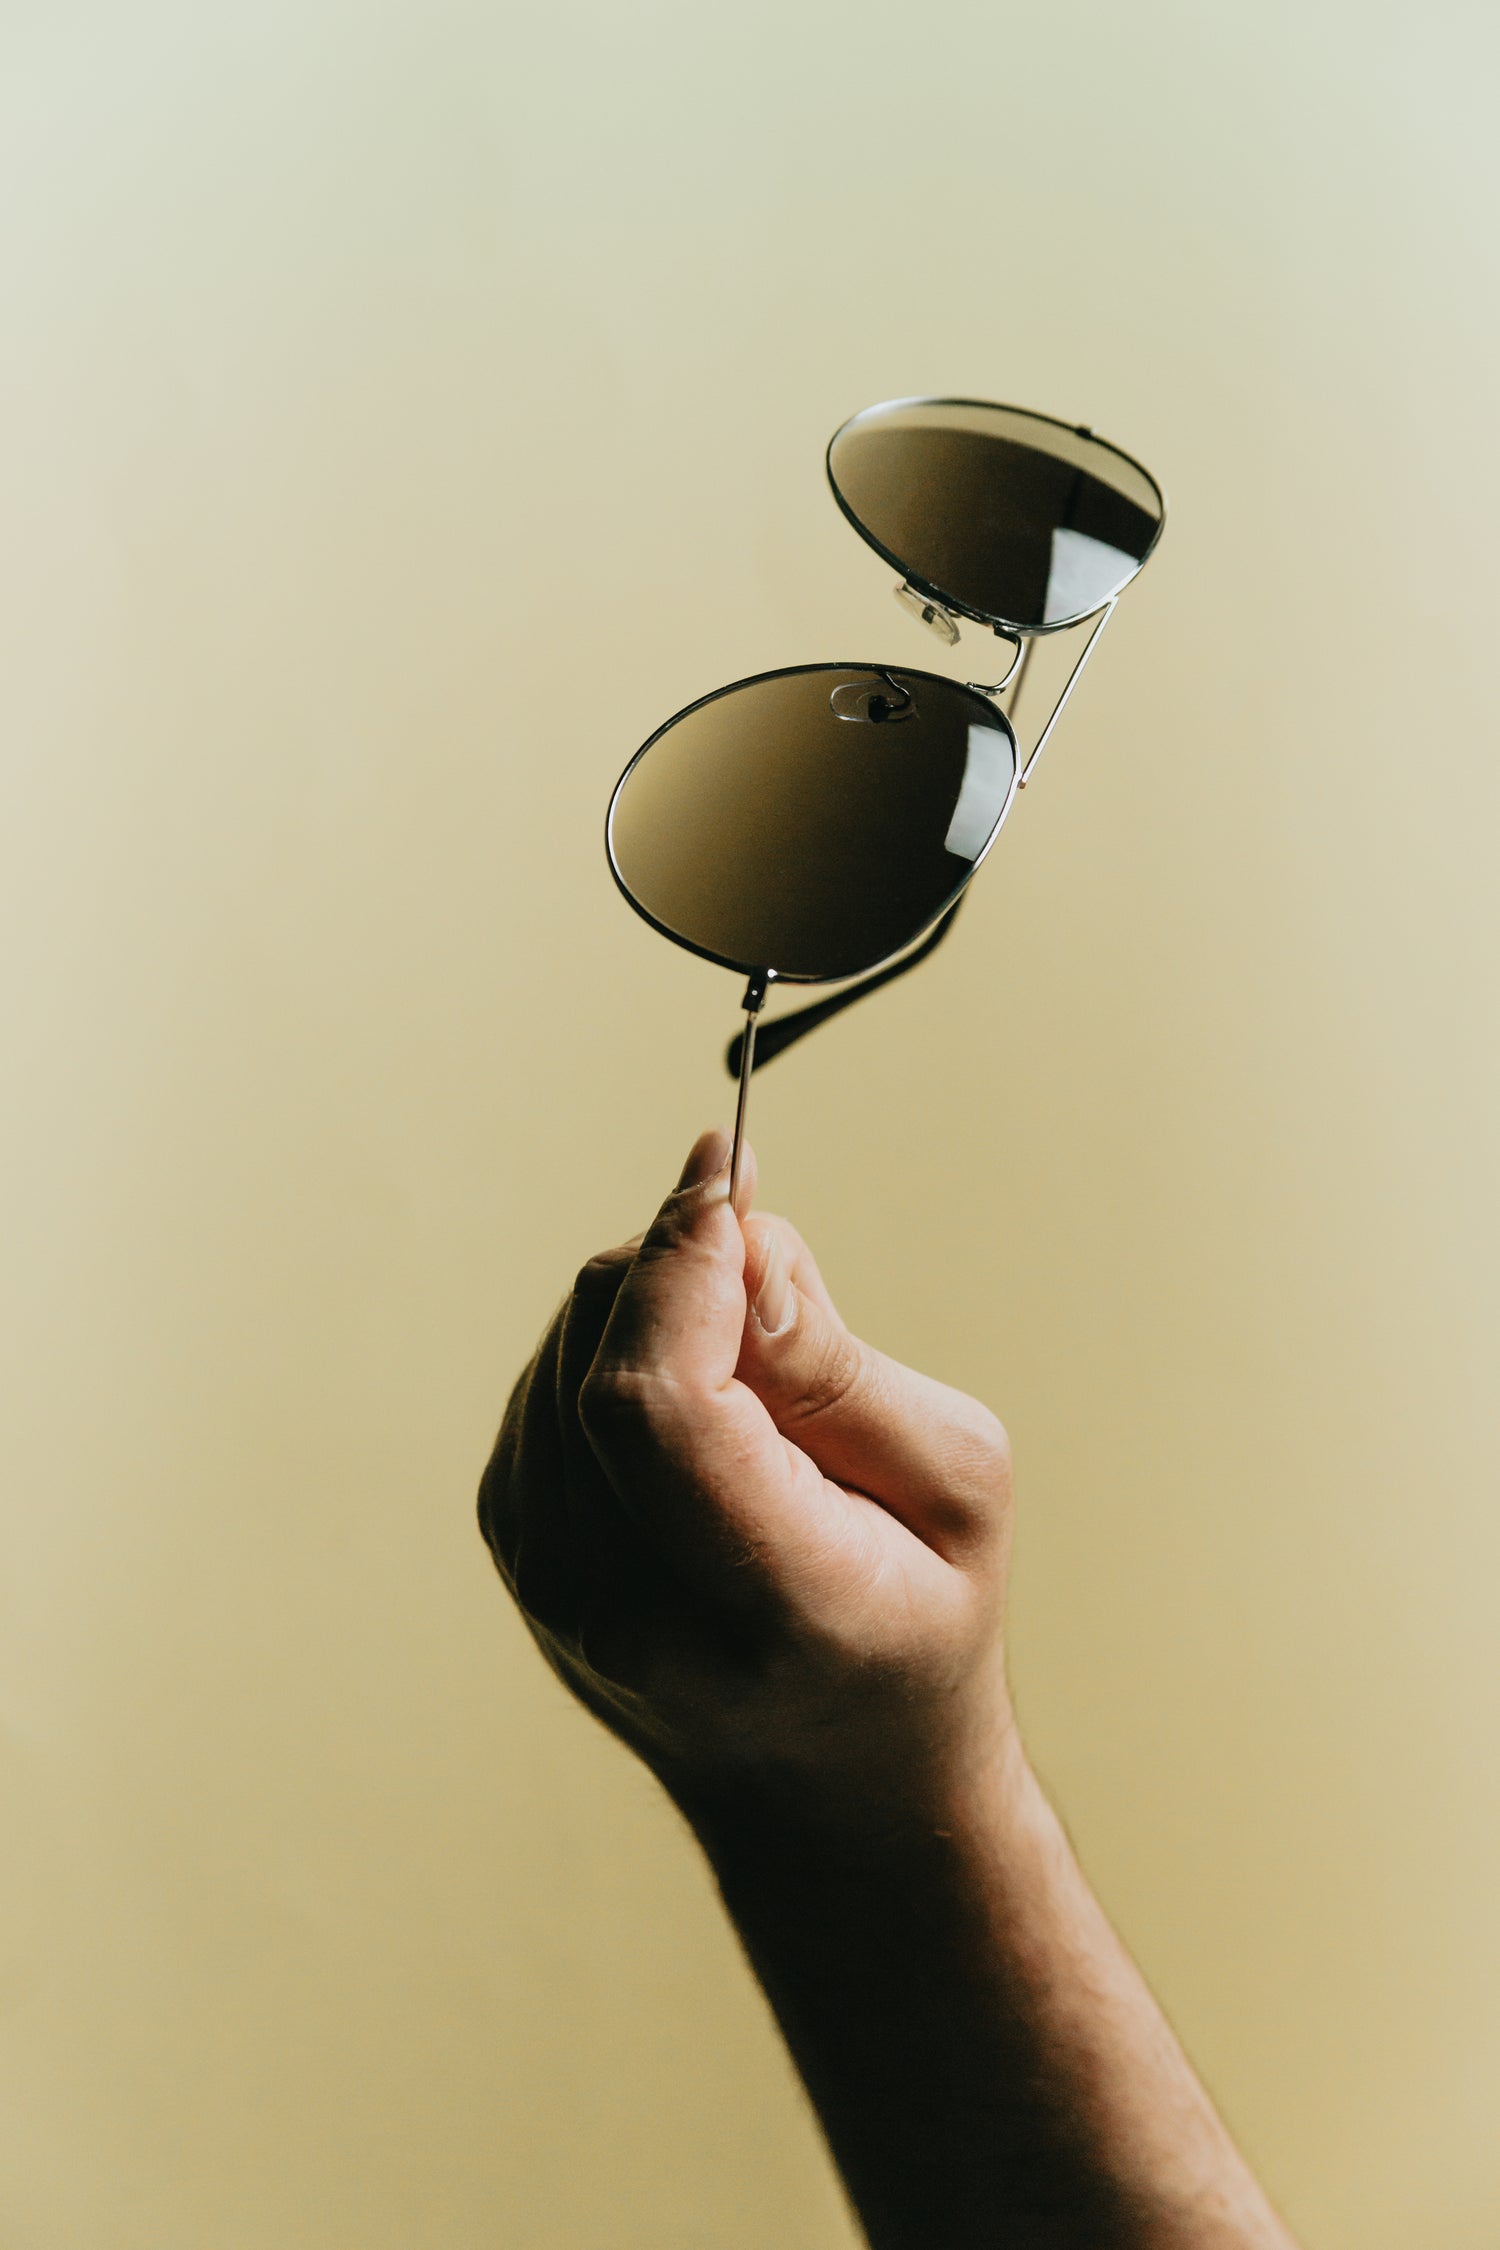
Sunglasses Protection
Using absorbance spectroscopy measures, sunglasses effectiveness can be measured with OPS solid sampler, identifying sunglasses effectiveness and differences between quality of sunglasses for protection.

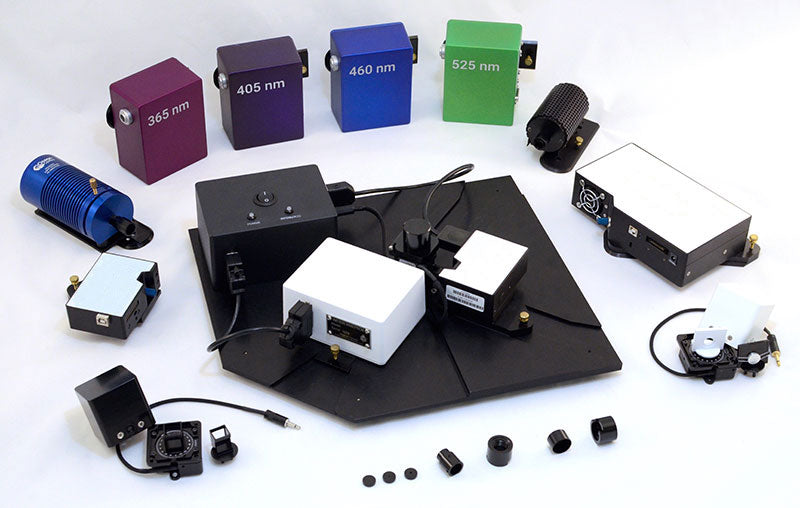
OPEN PLATFORM SYSTEM
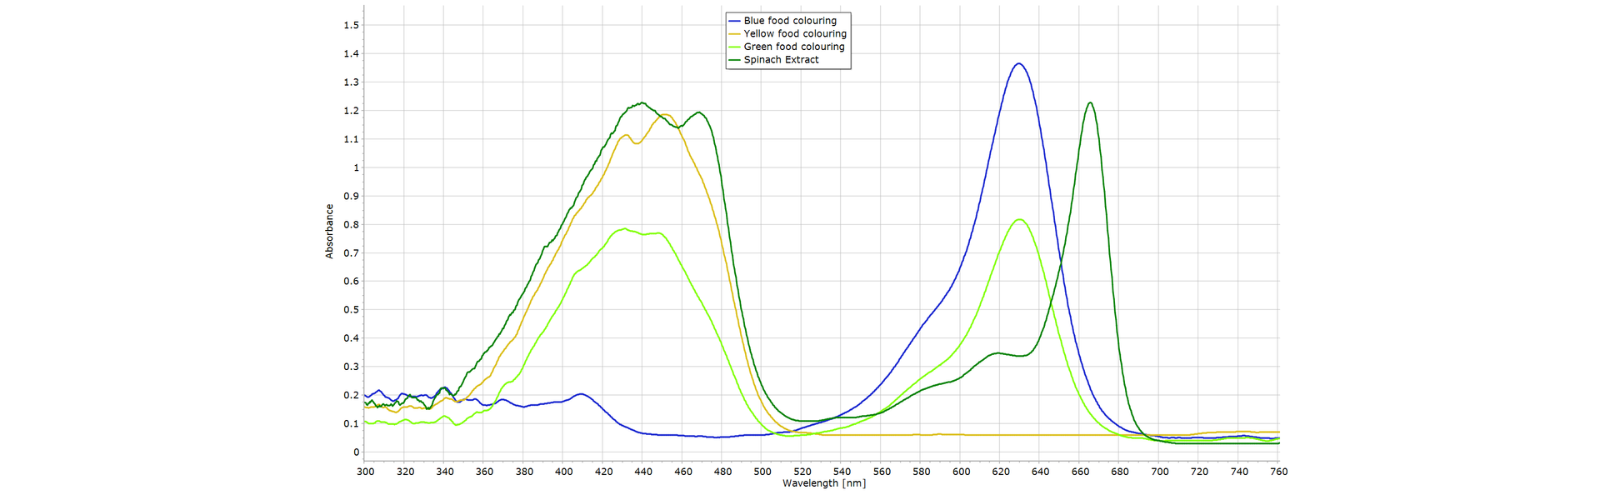
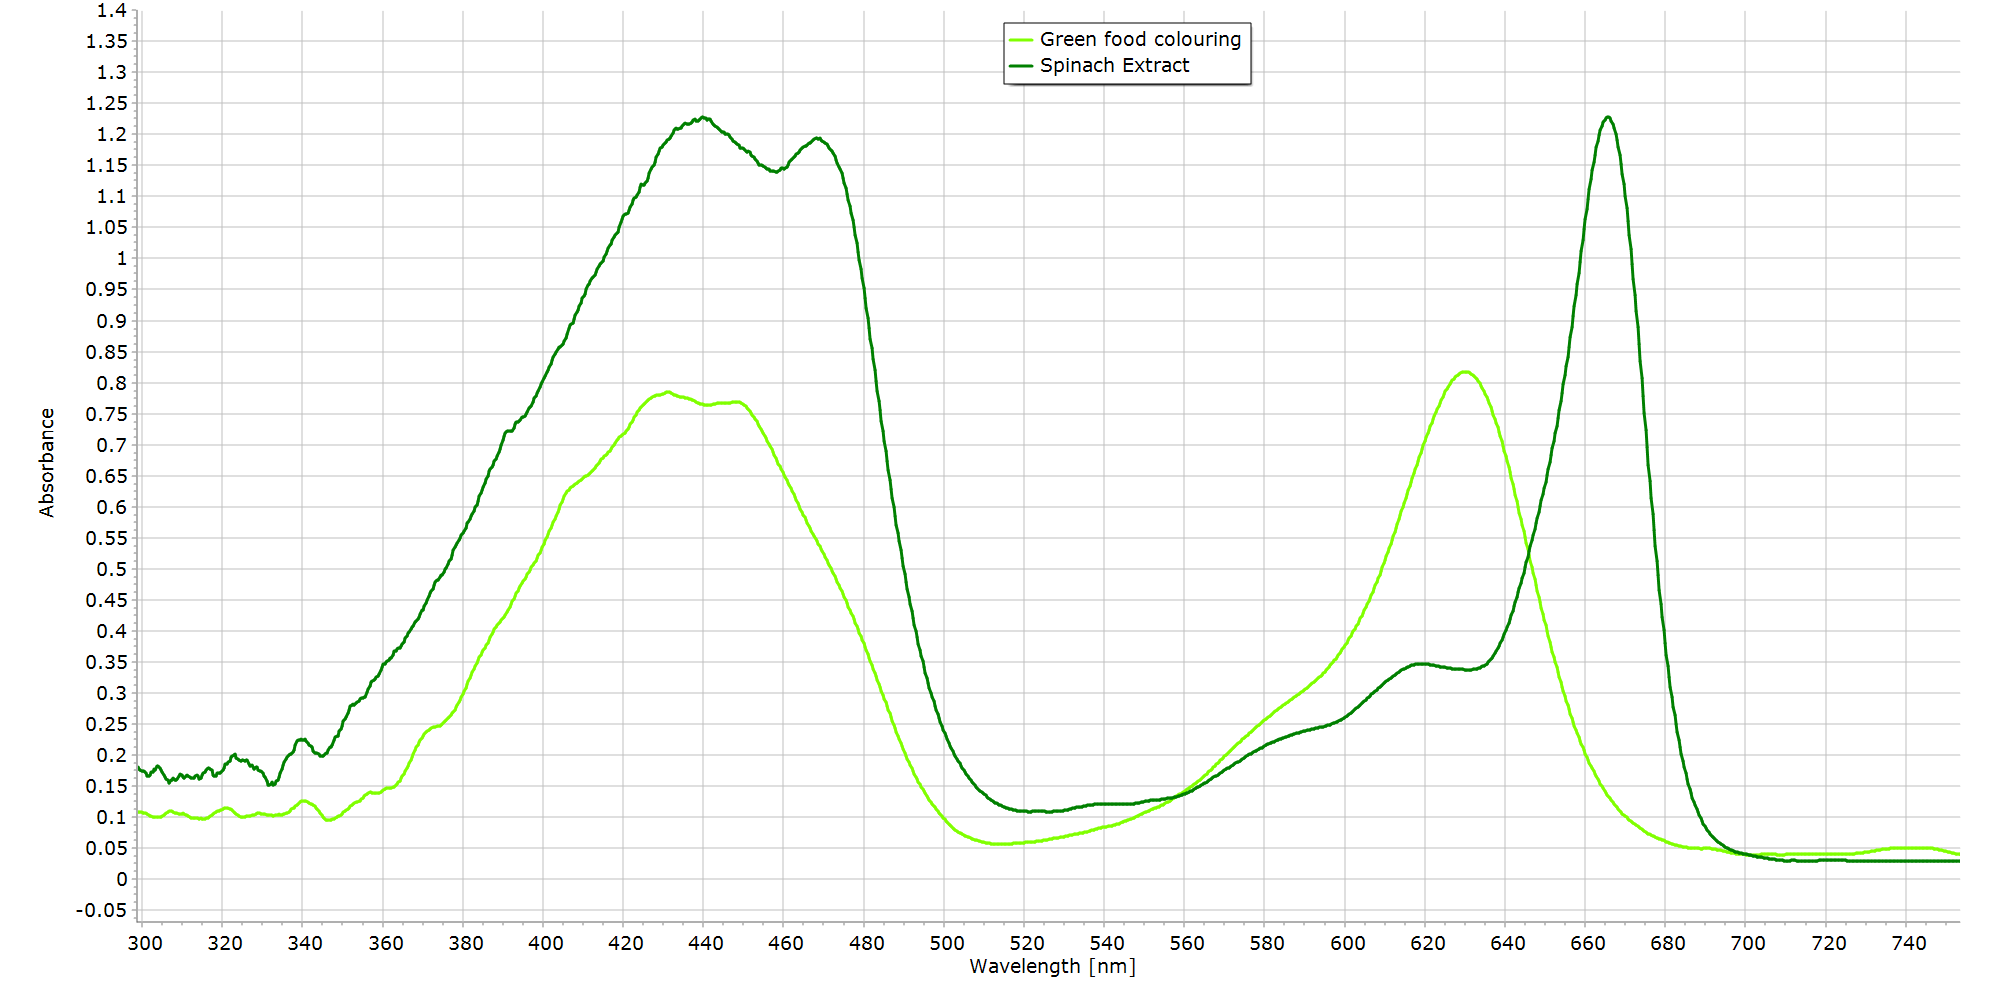
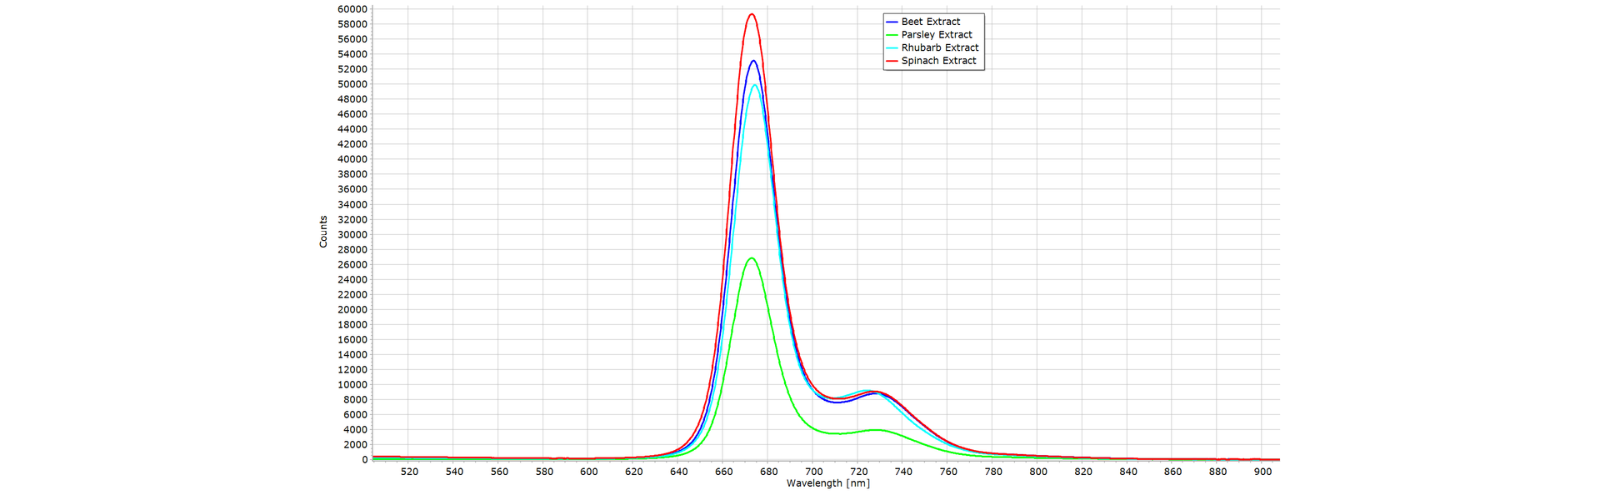
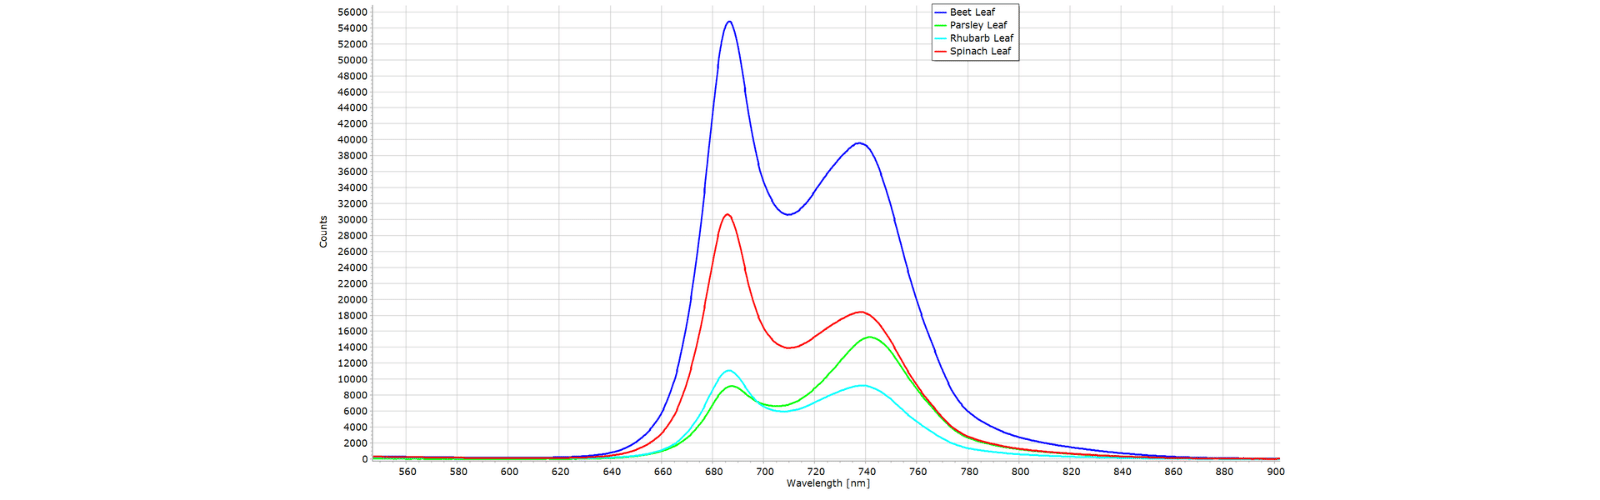
Chlorophyll in Leafy Vegetables
Our Open Platform System can measure the presence of Chlorophyll in various leaves via liquid extract or solid leaf sample. Our measurements were performed on the leaves of Spinach, Rhubarb, Beetroot, and Parsley, as seen below.
OPEN PLATFORM SYSTEM
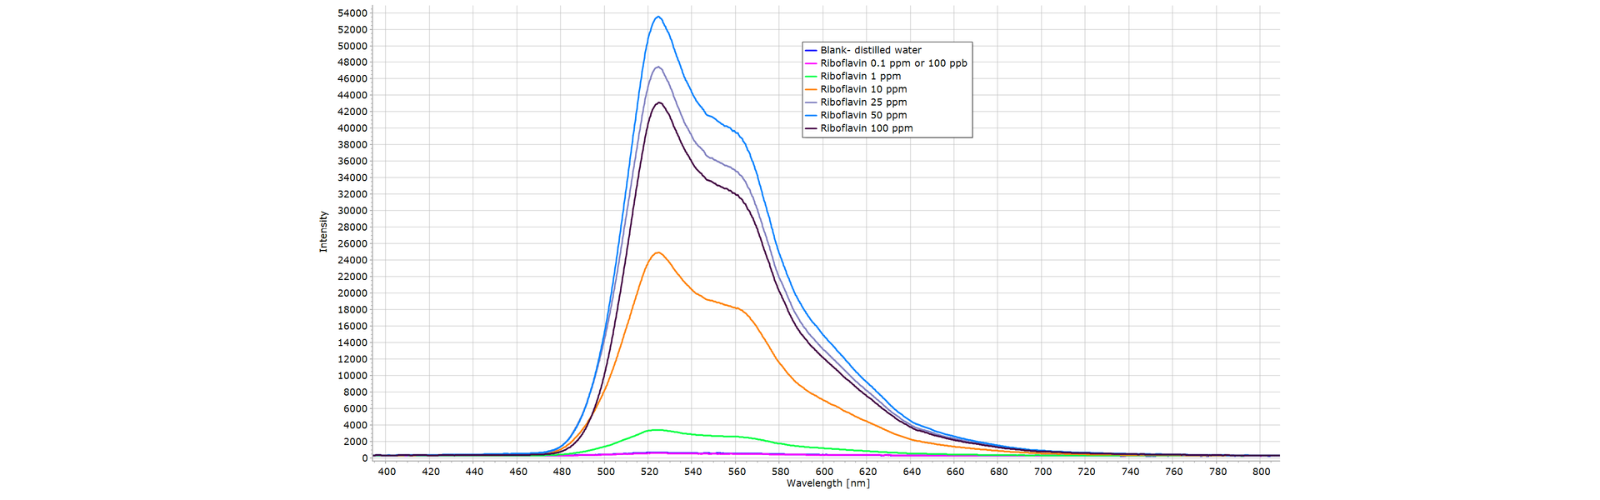
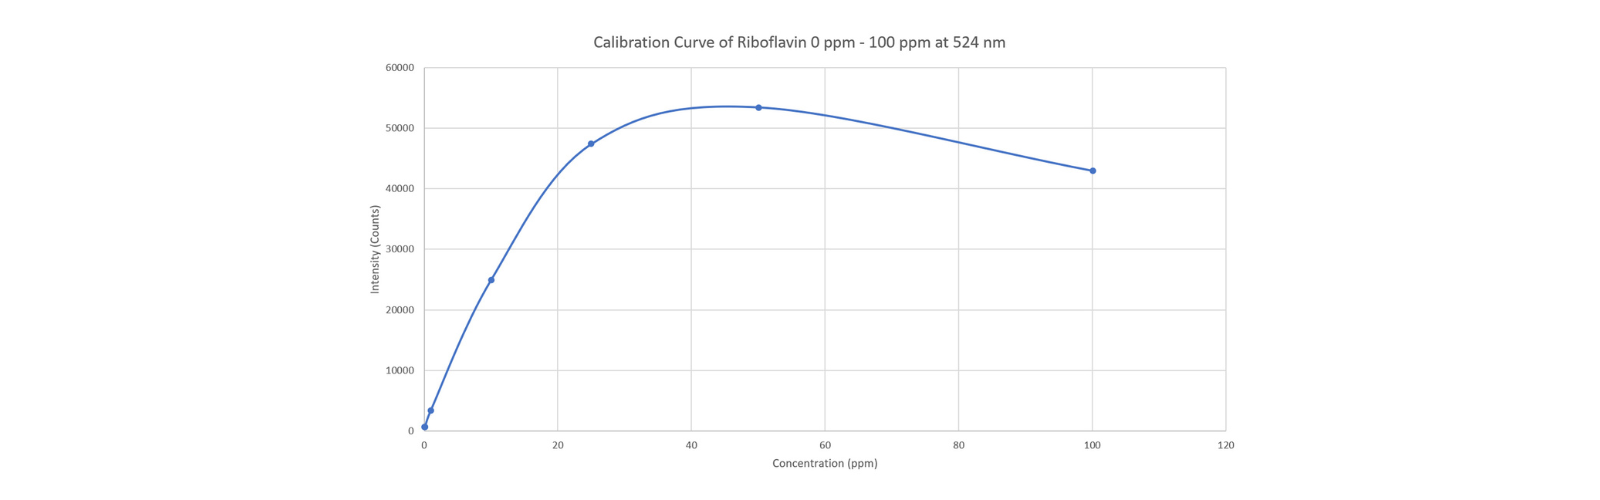
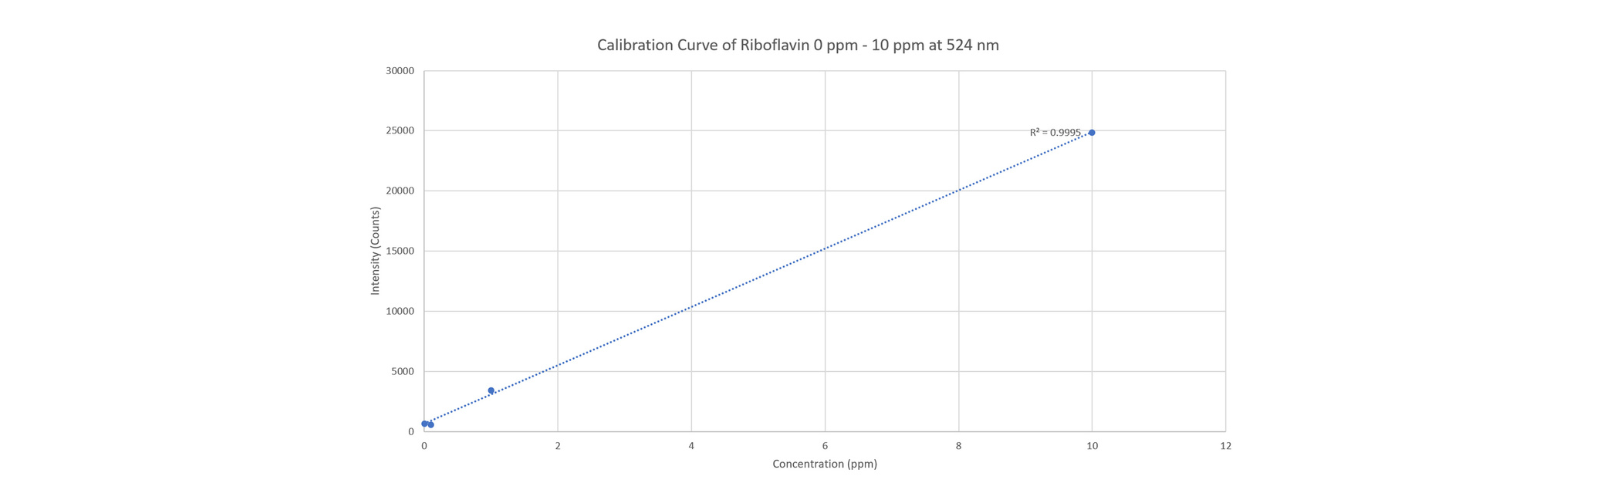
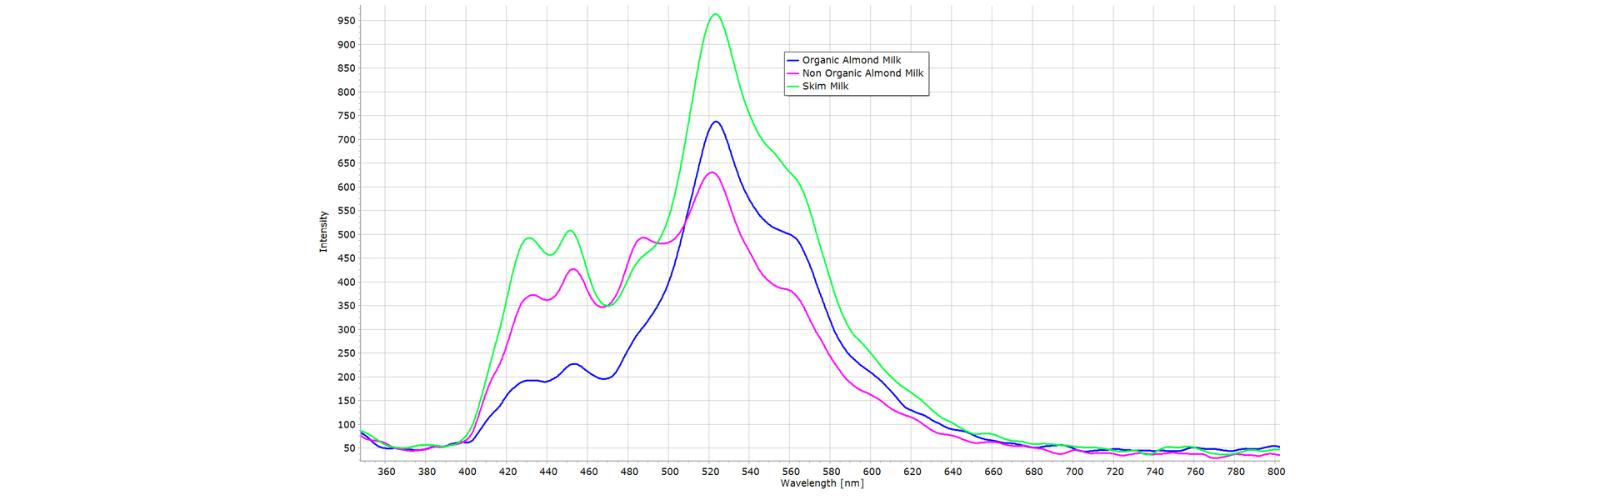
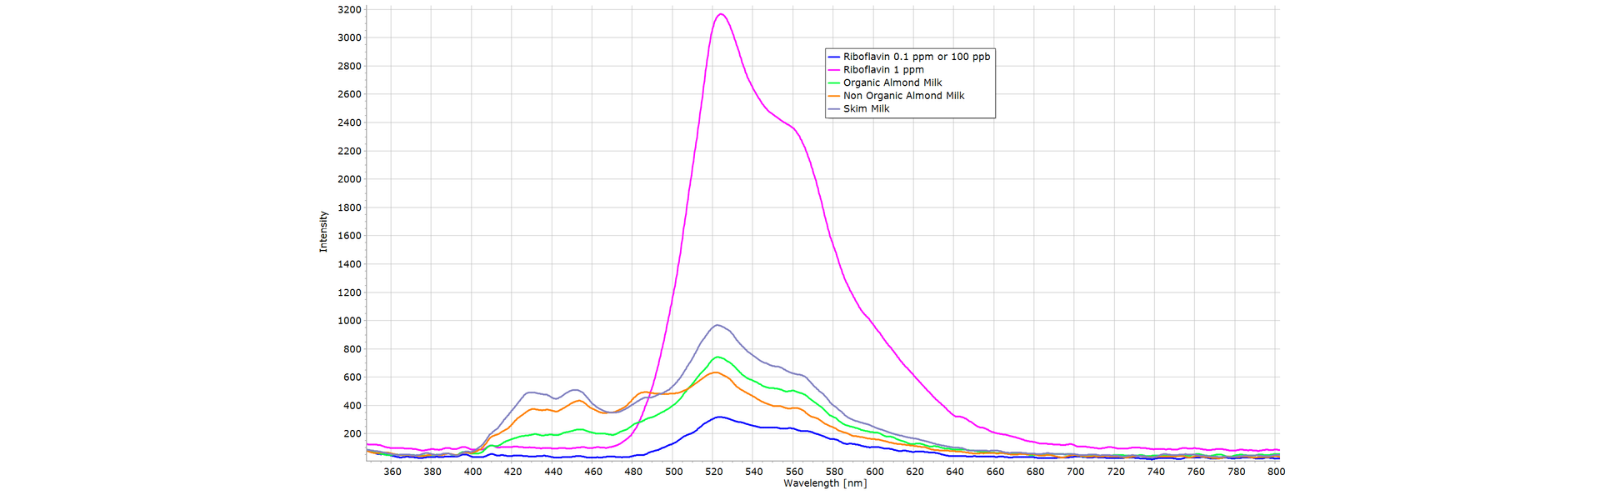
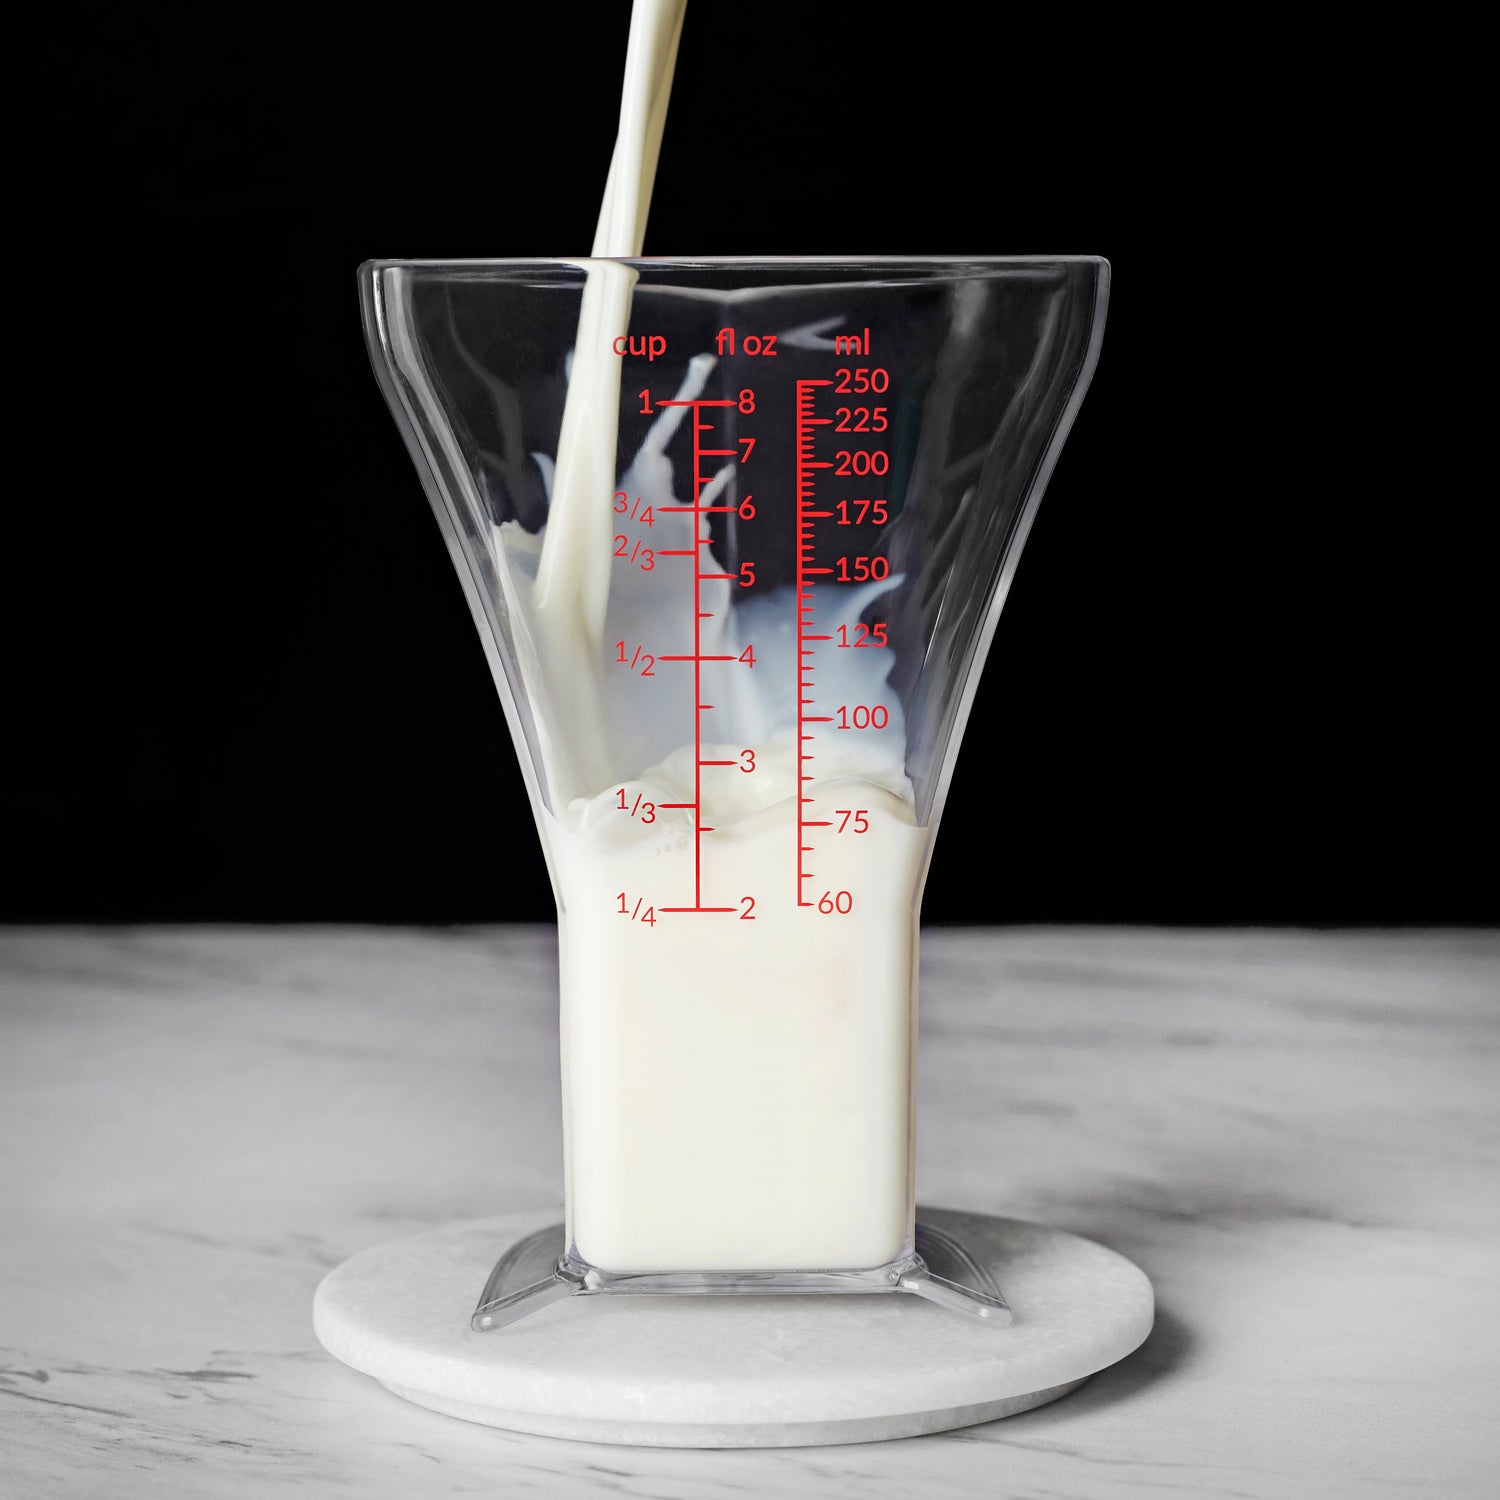
Riboflavin in Milk
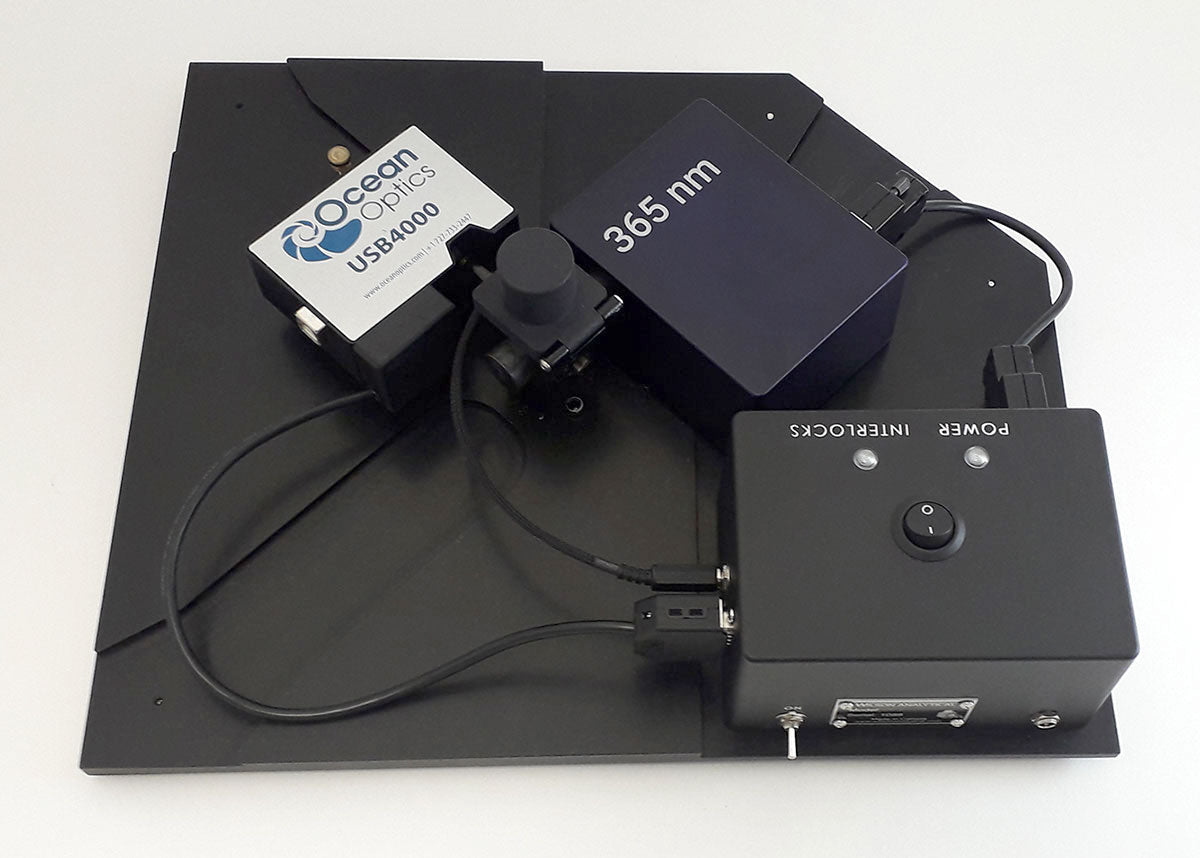
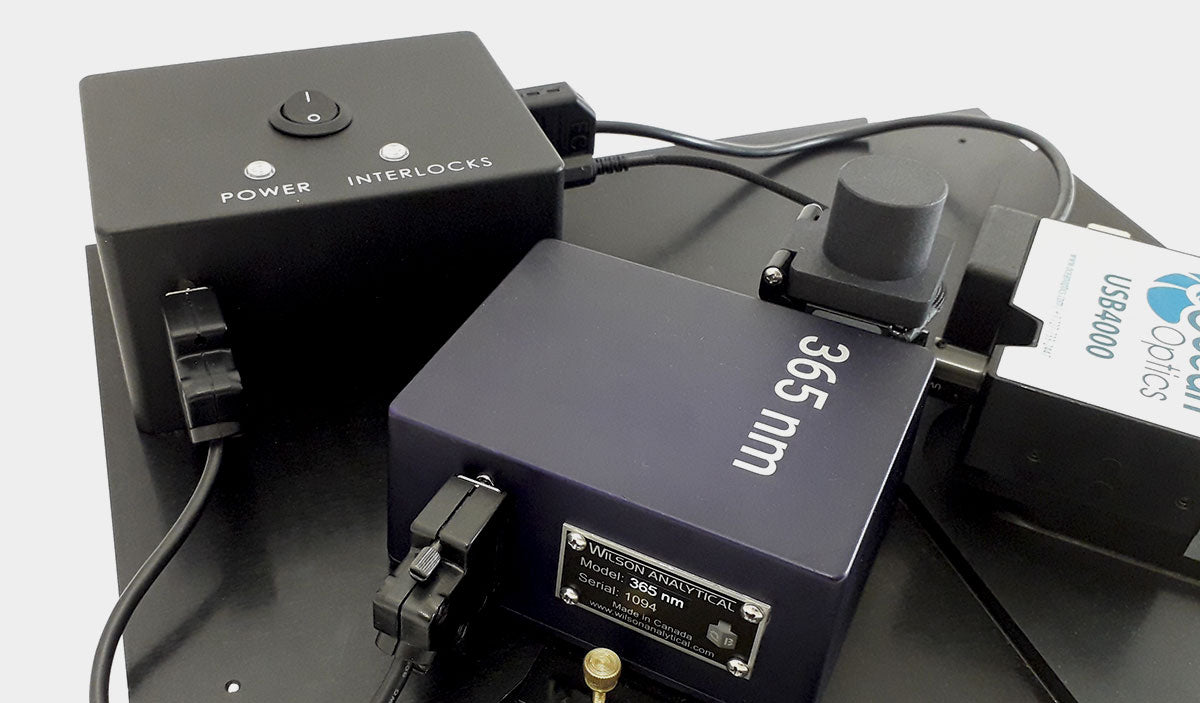
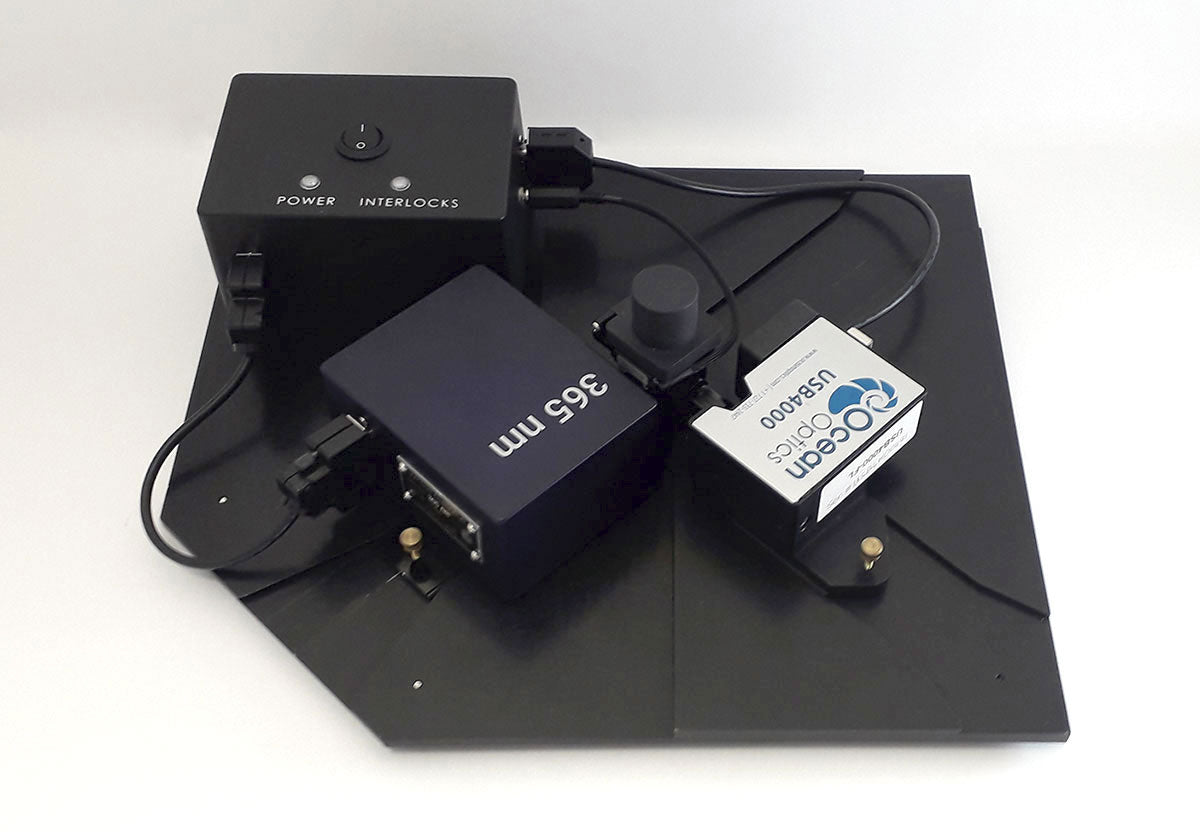
The Open Platform System can be used to easily measure organic liquid samples. The presence of Riboflavin in various milk samples were measured using our 365 nm light source.